Breaking Down a Decade’s Worth of Budget Bills
Last week on the blog, we discussed Governor Healey’s budget bill for the upcoming 2024 fiscal year. In conjunction with the in-depth examination of that bill, we have done a deep dive into the budgets dating back to fiscal year 2015, all the way to the current 2023 fiscal year. Unfortunately, due to the fact that the budget for the 2024 fiscal year is still in the early stages of approval, much of the pieces of information are still missing, and it cannot be analyzed here to the same extent as the prior budgets.
Our analysis of these past budgets involves amendments proposed and adopted, outside sections, earmarks, and amount proposed per chamber. All of this research serves to highlight some of the most recent budget trends and to analyze how the budget has been, and continues to be, evolving over recent years. These various trends help broaden our understanding of the budget and the many complex pieces that go into its establishment and approval.
Topic 1: Amendments Proposed and Adopted

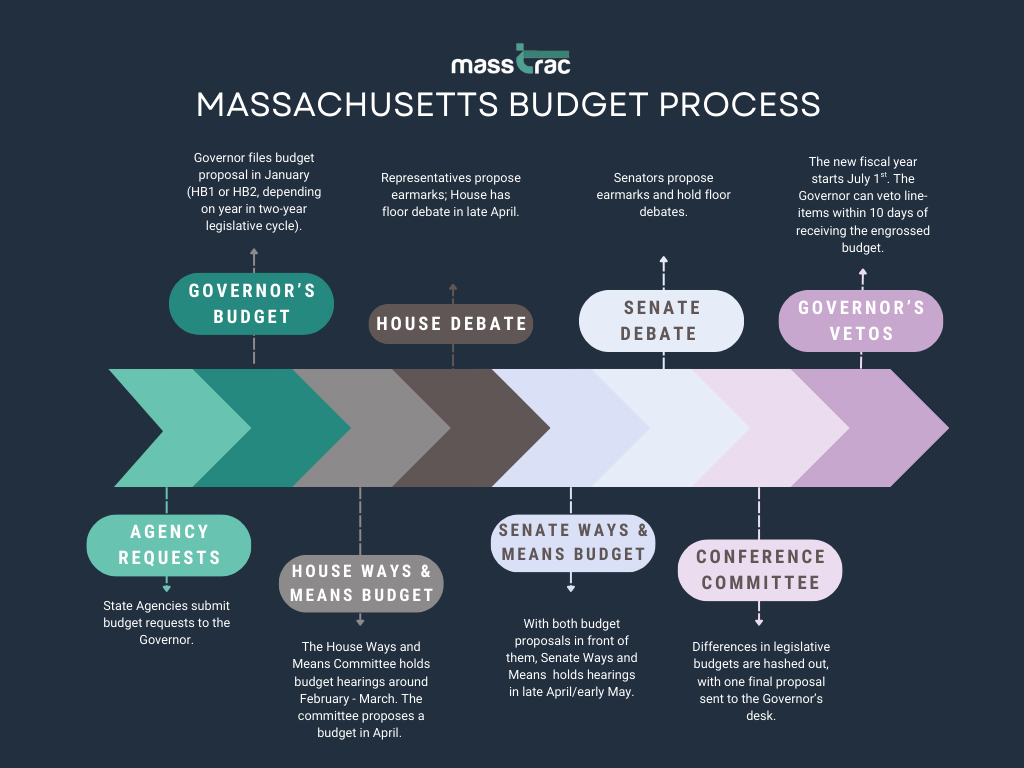
Amongst the many important steps that occur throughout the budget process, the amendments proposed and passed by both the House and the Senate are vital for understanding the way a budget bill morphs. After the finalization of the budget by both Chambers and the Governor, amendments may be proposed. But first, let’s dive into how the budget starts. The budget from the Governor’s Office is sent to the House Ways and Means Committee, where Representatives debate sections and propose amendments in hopes of their adoption. After debate on the House floor, their finalized bill then moves on to the Senate, where this process is repeated. The number of budget amendments proposed and adopted show that amendments are a very utilized tool for the Legislature and Governor to circumvent traditional process of bill debate. Perhaps the budget would not pass if such a provision was included originally, but if presented in the form of an amendment, it may have a better chance.
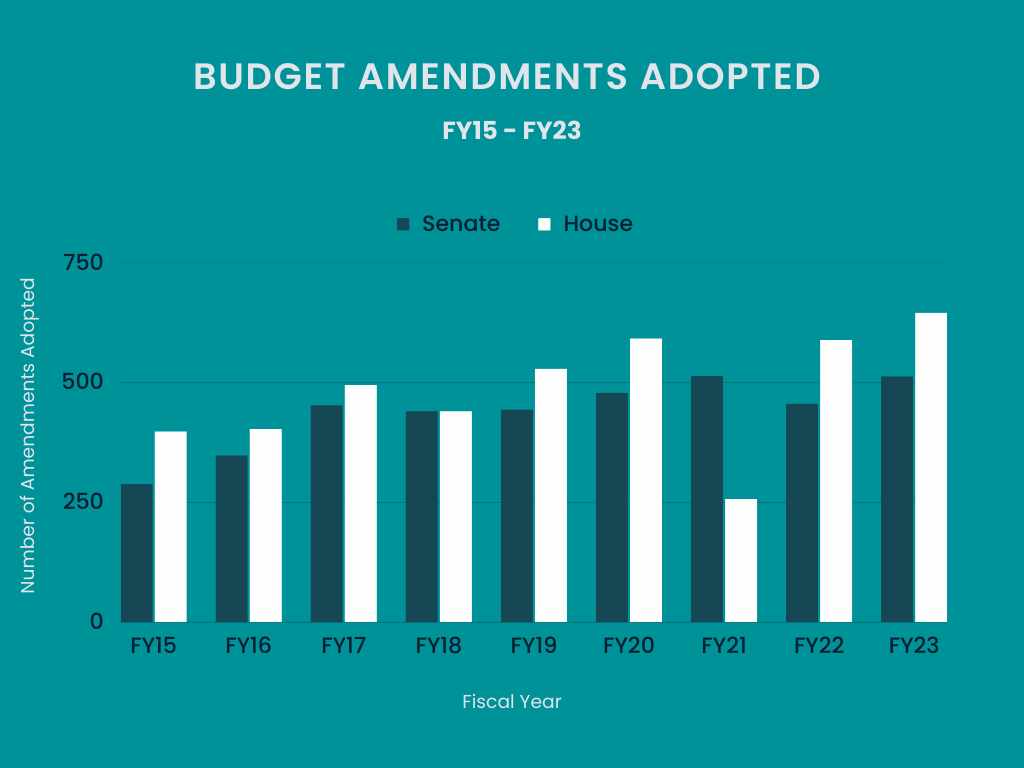
In the past decade, the House averaged 1,221 amendments, reaching a high for Fiscal Year (FY) 2023 with 1,529 amendments. FY2021 saw the lowest number of amendments, with 783, a little over half of the decade’s high. The number of amendments proposed, however, is ultimately inconsequential if they are not then adopted. In the past decade, the House averaged 482 amendments passed (39.5% of average proposed). Logically, the years with the most and least amendments proposed had the most and least adopted, respectively. FY2021 only had 257 adopted, about 33% of the total, the lowest of the decade. On the other hand, FY2023 had the most adopted with 645 amendments passing, about 42%. Though FY2023 had the highest quantity of passing amendments, FY2022 could be argued the most successful for the House with just over half, 53%, of their amendments adopted.
The Senate’s history this past decade tells a very similar story, with an average of 1,001 amendments, and consistently lower amendments proposed per year. They shared a low with the House for FY2021 with just 475 amendments. Their high was just over the average, with 1,196 amendments for FY2019. The Senate, on average, fares better than the house with a mean of 436 amendments passed (43.6% of average). Their low was also FY2021, a trend seen throughout, with only 176 amendments adopted, about 37%. Their high was also in FY2023, with 512 adopted, a 43.4% success rate. Once again, FY2022 could be perceived as the most successful year for the Senate, with a little under half, 49.2%, of their amendments passed.
The number of amendments proposed, as well as the ratio to those approved, has generally increased in the past decade, with the exception of a significant dip in FY2021, due to COVID-19. Congress was fully remote and debates were held via livestream, where some things could’ve been seen as extra unnecessary work. Also the nature of remote work often hinders the ease of collaboration.
Topic 2: Outside Sections

Another important aspect of our analysis involved outside sections. Outside sections are at the end of the budget, following section 3. These sections have specific provisions that control the particular appropriations in the budget, as well as creating laws that apply for one fiscal year, and amending the General Laws to pass various changes. The number of outside sections changes depending on where the budget bill is in the approval process. Typically, the Governor, the House, the Senate, and the final budget versions all have different numbers of outside sections. This occurs because throughout the process, outside sections may get added, edited, or removed. A budget bill almost never finishes with the same number of outside sections it started with and typically the number of these sections increases as it makes its way through the budget process.
Since FY2015, there has not been one specific trend in outside sections. From year to year, the number of these sections varies. For example, in 2016 the number of outside sections were as follows: 43 in the Governor’s version, 71 in the House, 106 in the Senate, and 191 in the final version. In FY2020 there were 79 sections in the Governor’s version, 54 in the House, 76 in the Senate, and 107 in the final. While the numbers did vary from 2016 to 2019, there was no meaningful change across all versions of the budget that indicate a trend in the amount. However, fiscal years 2021 and 2022 are an exception to this trend as the number of outside sections in the Governor’s version was larger than normal and close to the number of outside sections in the final version as well. The outside sections included multiple surrounding the state’s COVID-19 response, which could account for the Governor’s higher number.
The most noticeable trend is that, traditionally, the final budget will have a higher number of outside sections. For the 2018 fiscal year, the Governor's version of the budget bill had 82 outside sections, while the final version had 149. Similarly, in FY2022, the budget bill had only 46 sections after it had gone through the House, but the final version ended up having 145 outside sections. This makes sense, as by the time the budget is finalized, it will have already been through the Governor, the House, and the Senate who all make their own various changes to these sections. However, it appears that the number of outside sections per budget bill varies and that there isn’t necessarily a trend that the amount of outside sections follows each fiscal year.
Topic 3: Earmarks

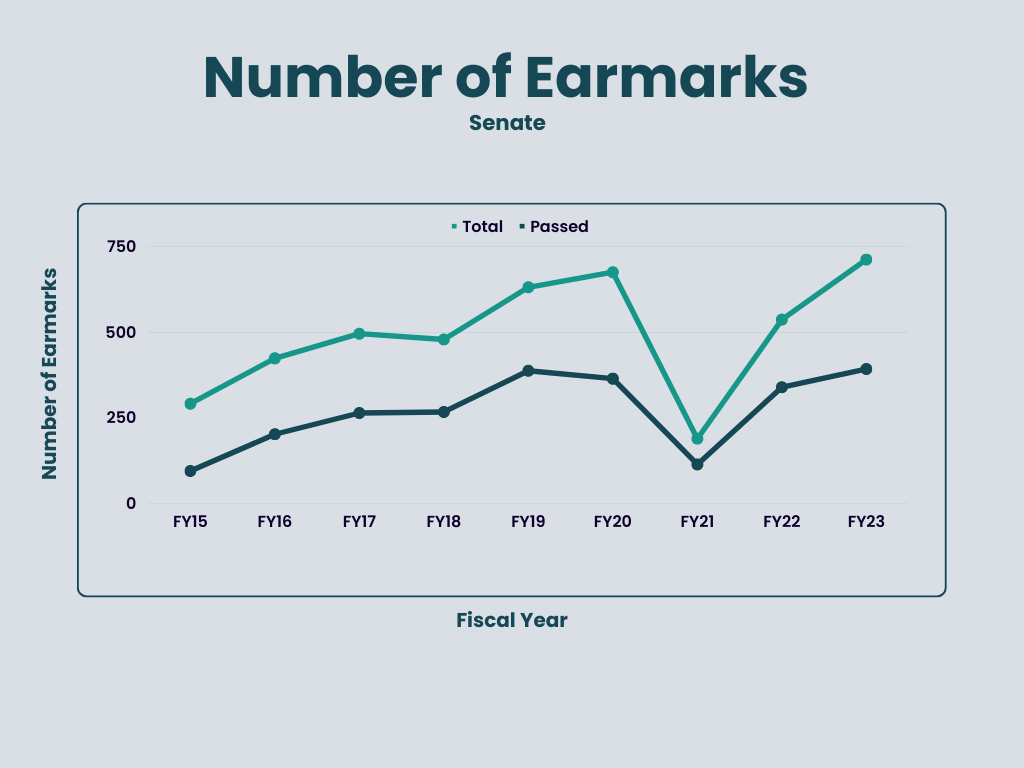
One of the more complex areas of the budget that we delved into involved earmarks, which are text that provides a certain amount of the money in the budget is spent on or for a specific thing. Earmarks are designed to allow legislators to target specific projects or areas of needs for their constituents. While the amount of earmarks included in the budget every year seems very large (the combined average of the amount proposed in the Senate and the House dating back to FYFY2015 is 569 per year), in reality earmarks make up a fairly small percentage of the budget and don’t typically take up that many funds.
In our analysis, we found a consistent increase in the number of earmarks that were passed in the House from fiscal year to fiscal year. In FY2015, the first fiscal year of our analysis, there were 186 earmarks that passed. In FY2023 the number jumped to 551. Meanwhile the Senate tells a different story with a fairly consistent number of earmarks passed each year, typically in the range of upper 200s all the way to almost 400. Of course there are a few outliers with the FY2021 budget only recording 115 passed earmarks. The difference in amount between chambers can likely be explained by the fact that the members of the House have smaller jurisdictions than the Senate and are better able to work more closely with their constituents. This ability to work closer together leads to a broader understanding of the financial needs of the community in which they represent. Senators, who have larger jurisdictions, have a harder time being able to represent all of their constituents, one may presume.
Topic 4: Amount Proposed Per Chamber

The central focus of the budget is, of course, the amount proposed each year. While we often hear of the overall number set by the Governor, each chamber is able to provide input into this number. The House, following debates and edits, releases their final version of the bill, which is then sent to the Senate for consideration. The process is repeated, and following the Senate’s budget release, a Joint Conference Committee reconciles the difference between both Chambers’ proposals. Eventually the final budget is sent back to the Governor’s Office. The differences between each Chamber’s proposal can reveal interesting information about their political and economic focuses. That being said, the monetary differences between both budget proposals have been minimal.
The following figures have been adjusted for inflation using the COLI index, in order to have the most accurate comparison of the Chambers’ budget across the decade. The House and Senate shared an average proposed budget of a little over $55 billion, in line with the current proposed budget for FY2024. The range of both chambers reflect each other, with a minimum of roughly $50 billion for FY2015 and a maximum of $60 billion for FY2022. A general increase can be seen for both chambers throughout the decade, with the exception of a significant dip for FY2021, especially in the House. This is likely due to the financial restrictions put in place due to COVID-19, with lower tax revenue due to higher unemployment and lower economic activity occurring in 2020.
The budget is a very complex piece of legislation made up of intricate parts. It is worth analyzing to gain a better understanding of the budget bill and all that goes into it. Along with understanding the numerous parts, it is also important to note any changes and evolution.
The budget process seems to have remained relatively stable in the past decade, with the only significant changes being for FY2021, likely due to the impact of COVID-19. Understanding the trends and expectations for the budget process allows for clear discernment of any changes, which are indicative of the political and economic conditions of the state. As we watch FY2024 undergo the months-long budget process, we can expect to see many of the same trends, while keeping an eye on any outliers and what they may reflect economically.
Staying on top of such an important bill may seem overwhelming, but with comprehensible section-by-section budget summaries, amendment summaries, and outside sections reports, InstaTrac makes it easy! Never miss a blog post - and stay on top of what’s happening on Beacon Hill! Follow us on Twitter, Linkedin, Youtube, or Instagram.